Jellyfish + GenomeScope2 --- 组装前的基因组分析

Introduction

当我们需要组装一个新物种时,采用各种组装工具进行组装总是需要调各种参数,才能达到我们期望的质量。如设置基因组大小,此外还可能根据基因组的杂合度、重复率等来预览基因组。这里介绍一种基于 k-mer 的基因组分析 — Jellfish + GenomeScope

k-mer 是什么?

对于我们拿到的 illumina 测序数据,迭代选取长度为 k 的序列片段。也就是说 k-mer 是一段碱基的子串。

  • read=ATGCTGAk=4

此外,随着 k 值的增加,四种碱基(A, T, G, C)组合成的 k-mer 数量会成指数增长。即:

k=21 对于植物基因组组装来说是属于很安全的 k 值,当 k=21 时,可能的 k-mer 将有 4,398,046,511,104,超过万亿中可能存在的 k-mer

得到 k-mer 之后,我们就能根据 k-mer 序列的出现频率对基因组的复杂度进行评估。主要有以下几个指标:

  • 基因组大小:在组装前获知基因组大小,将有助于我们如何分配计算资源;同时也能对组装结果有个初步的判断。此外还能在组装时告知工具基因组大小,从而提高组装质量(这是一个大致的范围,我们可以稍微设置得大一点)。
  • 杂合度大小:这是针对二倍体(多倍体)的概念,二倍体生物具有两套染色体,一套来自父本、一套来自母本。然而同源染色体之间可能是存在差异的;若两个同源染色体上相同基因座的两个基因不同,则个体在这个基因座上是杂合的,反之为纯合。杂合度对基因组组装的影响主要体现在不能合并姐妹染色体。
  • 重复片段大小:预估基因组的重复率;此外还可以通过 BUSCO 对得到的基因组进行评估,可获得重复率。

杂合度高的区域,会把两条姐妹染色单体都组装出来,从而造成组装的基因组偏大于实际的基因组大小。

杂合度高于 0.5% ,则认为组装有一定难度。

杂合度高于 1% ,则很难组装出来。

此外,需要明确的一点是,杂合度高,并不是代表不能组装出来,而是得到的基因组序列不适用于下游分析。

GenomeScope 是一个开源 Web 端 应用;在不需要参考基因组的情况下,快速估计基因组的整体特征,包括基因组大小、杂合率、未处理短读的重复率,这将有助于选择下游分析的参数。

Getting started

在这里 k-mer 分析,推进啊 Jellyfish + GenomeScope2 组合,当然你也可以使用 findGSE 来构建模型。

首先,还是通过 conda 来搭建分析所需要的环境:

1
2
3
4
5
6
7
8
9
conda create -n genomescope2 -c bioconda genomescope2 jellyfish
#
# To activate this environment, use
#
# $ conda activate genomescope2
#
# To deactivate an active environment, use
#
# $ conda deactivate

之后,我们便能通过 conda activate genomescope2 开启 k-mer 分析所需要的环境了;在运行 genomescope2 之前,我们需要利用 jellyfish 生成 k-mer 的频率直方图。

1
2
3
4
5
6
7
8
k=21
name=rojpas
fq1=trimmed_10x_genomics_R1.fastq
fq2=trimmed_10x_genomics_R2.fastq
#/public/home/wbjiao/bin/pigz-2.6/unpigz -p 8 ${fq1}.gz
#/public/home/wbjiao/bin/pigz-2.6/unpigz -p 8 ${fq2}.gz
{path}/jellyfish-2.2.10/bin/jellyfish count ./ -C -o ${name}_${k}mer -t 2 -s 30G -m ${k} ${fq1} ${fq2}
{p}/jellyfish-2.2.10/bin/jellyfish histo -t 2 -o ${name}_${k}mer.histo ${name}_${k}mer

我这里采用的是 10 Genomics 数据,在运行前,记得切去接头。

这里需要注意的是,jellyfish 并不能之前输入压缩文件,所以需要先将测序数据解压;或者通过 <(zcat ${name}.fq.gz)-C 参数是强烈建议加上的,表示统计正负链。

我们将 k 设置成 21 ,这是一个适用于大多数基因组的 k-mer 长度。因为这个长度足够长,大多数 k-mer 不会重复,并且足够短,分析对测序错误更加稳健。极大(单倍体大小 >>10GB)或非常重复的基因组可能受益于较大的 k-mer 长度,以增加独特 k-mer 的数量。此外,这里要求最低的覆盖度不能低于一个单倍体 15x,否则将会影响模型拟合。

得到 k-mer 分布之后,通过 Genomescope2 来绘制 k-mer plot ,并进行模型拟合。

1
2
## conda activate genomescope2
genomescope2 -i rojpas_21mer.histo -o Result -k 21 -p 2 -l 140

具体参数如下:

1
2
3
4
5
6
7
8
9
10
11
12
13
14
15
16
17
18
19
20
21
22
23
24
25
26
27
28
29
30
31
32
33
34
35
36
37
38
39
40
41
42
43
44
45
46
$ genomescope2 --help
usage: {path}/miniconda3/envs/genomescope2/bin/genomescope2
[-h] [-v] [-i INPUT] [-o OUTPUT] [-p PLOIDY] [-k KMER_LENGTH]
[-n NAME_PREFIX] [-l LAMBDA] [-m MAX_KMERCOV] [--verbose]
[--no_unique_sequence] [-t TOPOLOGY]
[--initial_repetitiveness INITIAL_REPETITIVENESS]
[--initial_heterozygosities INITIAL_HETEROZYGOSITIES]
[--transform_exp TRANSFORM_EXP] [--testing] [--true_params TRUE_PARAMS]
[--trace_flag] [--num_rounds NUM_ROUNDS] [--fitted_hist]

options:
-h, --help show this help message and exit
-v, --version print the version and exit
-i INPUT, --input INPUT
input histogram file
-o OUTPUT, --output OUTPUT
output directory name
-p PLOIDY, --ploidy PLOIDY
ploidy (1, 2, 3, 4, 5, or 6) for model to use [default
2]
-k KMER_LENGTH, --kmer_length KMER_LENGTH
kmer length used to calculate kmer spectra [default 21]
-n NAME_PREFIX, --name_prefix NAME_PREFIX
optional name_prefix for output files
-l LAMBDA, --lambda LAMBDA, --kcov LAMBDA, --kmercov LAMBDA
optional initial kmercov estimate for model to use
-m MAX_KMERCOV, --max_kmercov MAX_KMERCOV
optional maximum kmer coverage threshold (kmers with coverage greater than max_kmercov are ignored by the model)
--verbose optional flag to print messages during execution
--no_unique_sequence optional flag to turn off yellow unique sequence line in plots
-t TOPOLOGY, --topology TOPOLOGY
ADVANCED: flag for topology for model to use
--initial_repetitiveness INITIAL_REPETITIVENESS
ADVANCED: flag to set initial value for repetitiveness
--initial_heterozygosities INITIAL_HETEROZYGOSITIES
ADVANCED: flag to set initial values for nucleotide heterozygosity rates
--transform_exp TRANSFORM_EXP
ADVANCED: parameter for the exponent when fitting a transformed (x**transform_exp*y vs. x) kmer histogram [default 1]
--testing ADVANCED: flag to create testing.tsv file with model parameters
--true_params TRUE_PARAMS
ADVANCED: flag to state true simulated parameters for testing mode
--trace_flag ADVANCED: flag to turn on printing of iteration
progress of nlsLM function
--num_rounds NUM_ROUNDS
ADVANCED: parameter for the number of optimization rounds
--fitted_hist ADVANCED: generates a fitted histogram for kmer multiplicity 0-4 and a lookup table of probabilities

-i 输入 jellyfish 统计好的 k-mer 分布,即 ${name}_${k}mer.histo-o 输出文件夹;-k 设置的 k-mer 长度;-p 基因组的倍性,默认为二倍体。-m max_kmercov 指定从分析中排除高频 k-mers 的截止值。

Result

  • report
1
2
3
GenomeScope analyzing rojpas_21mer.histo p=2 k=21 outdir=Result
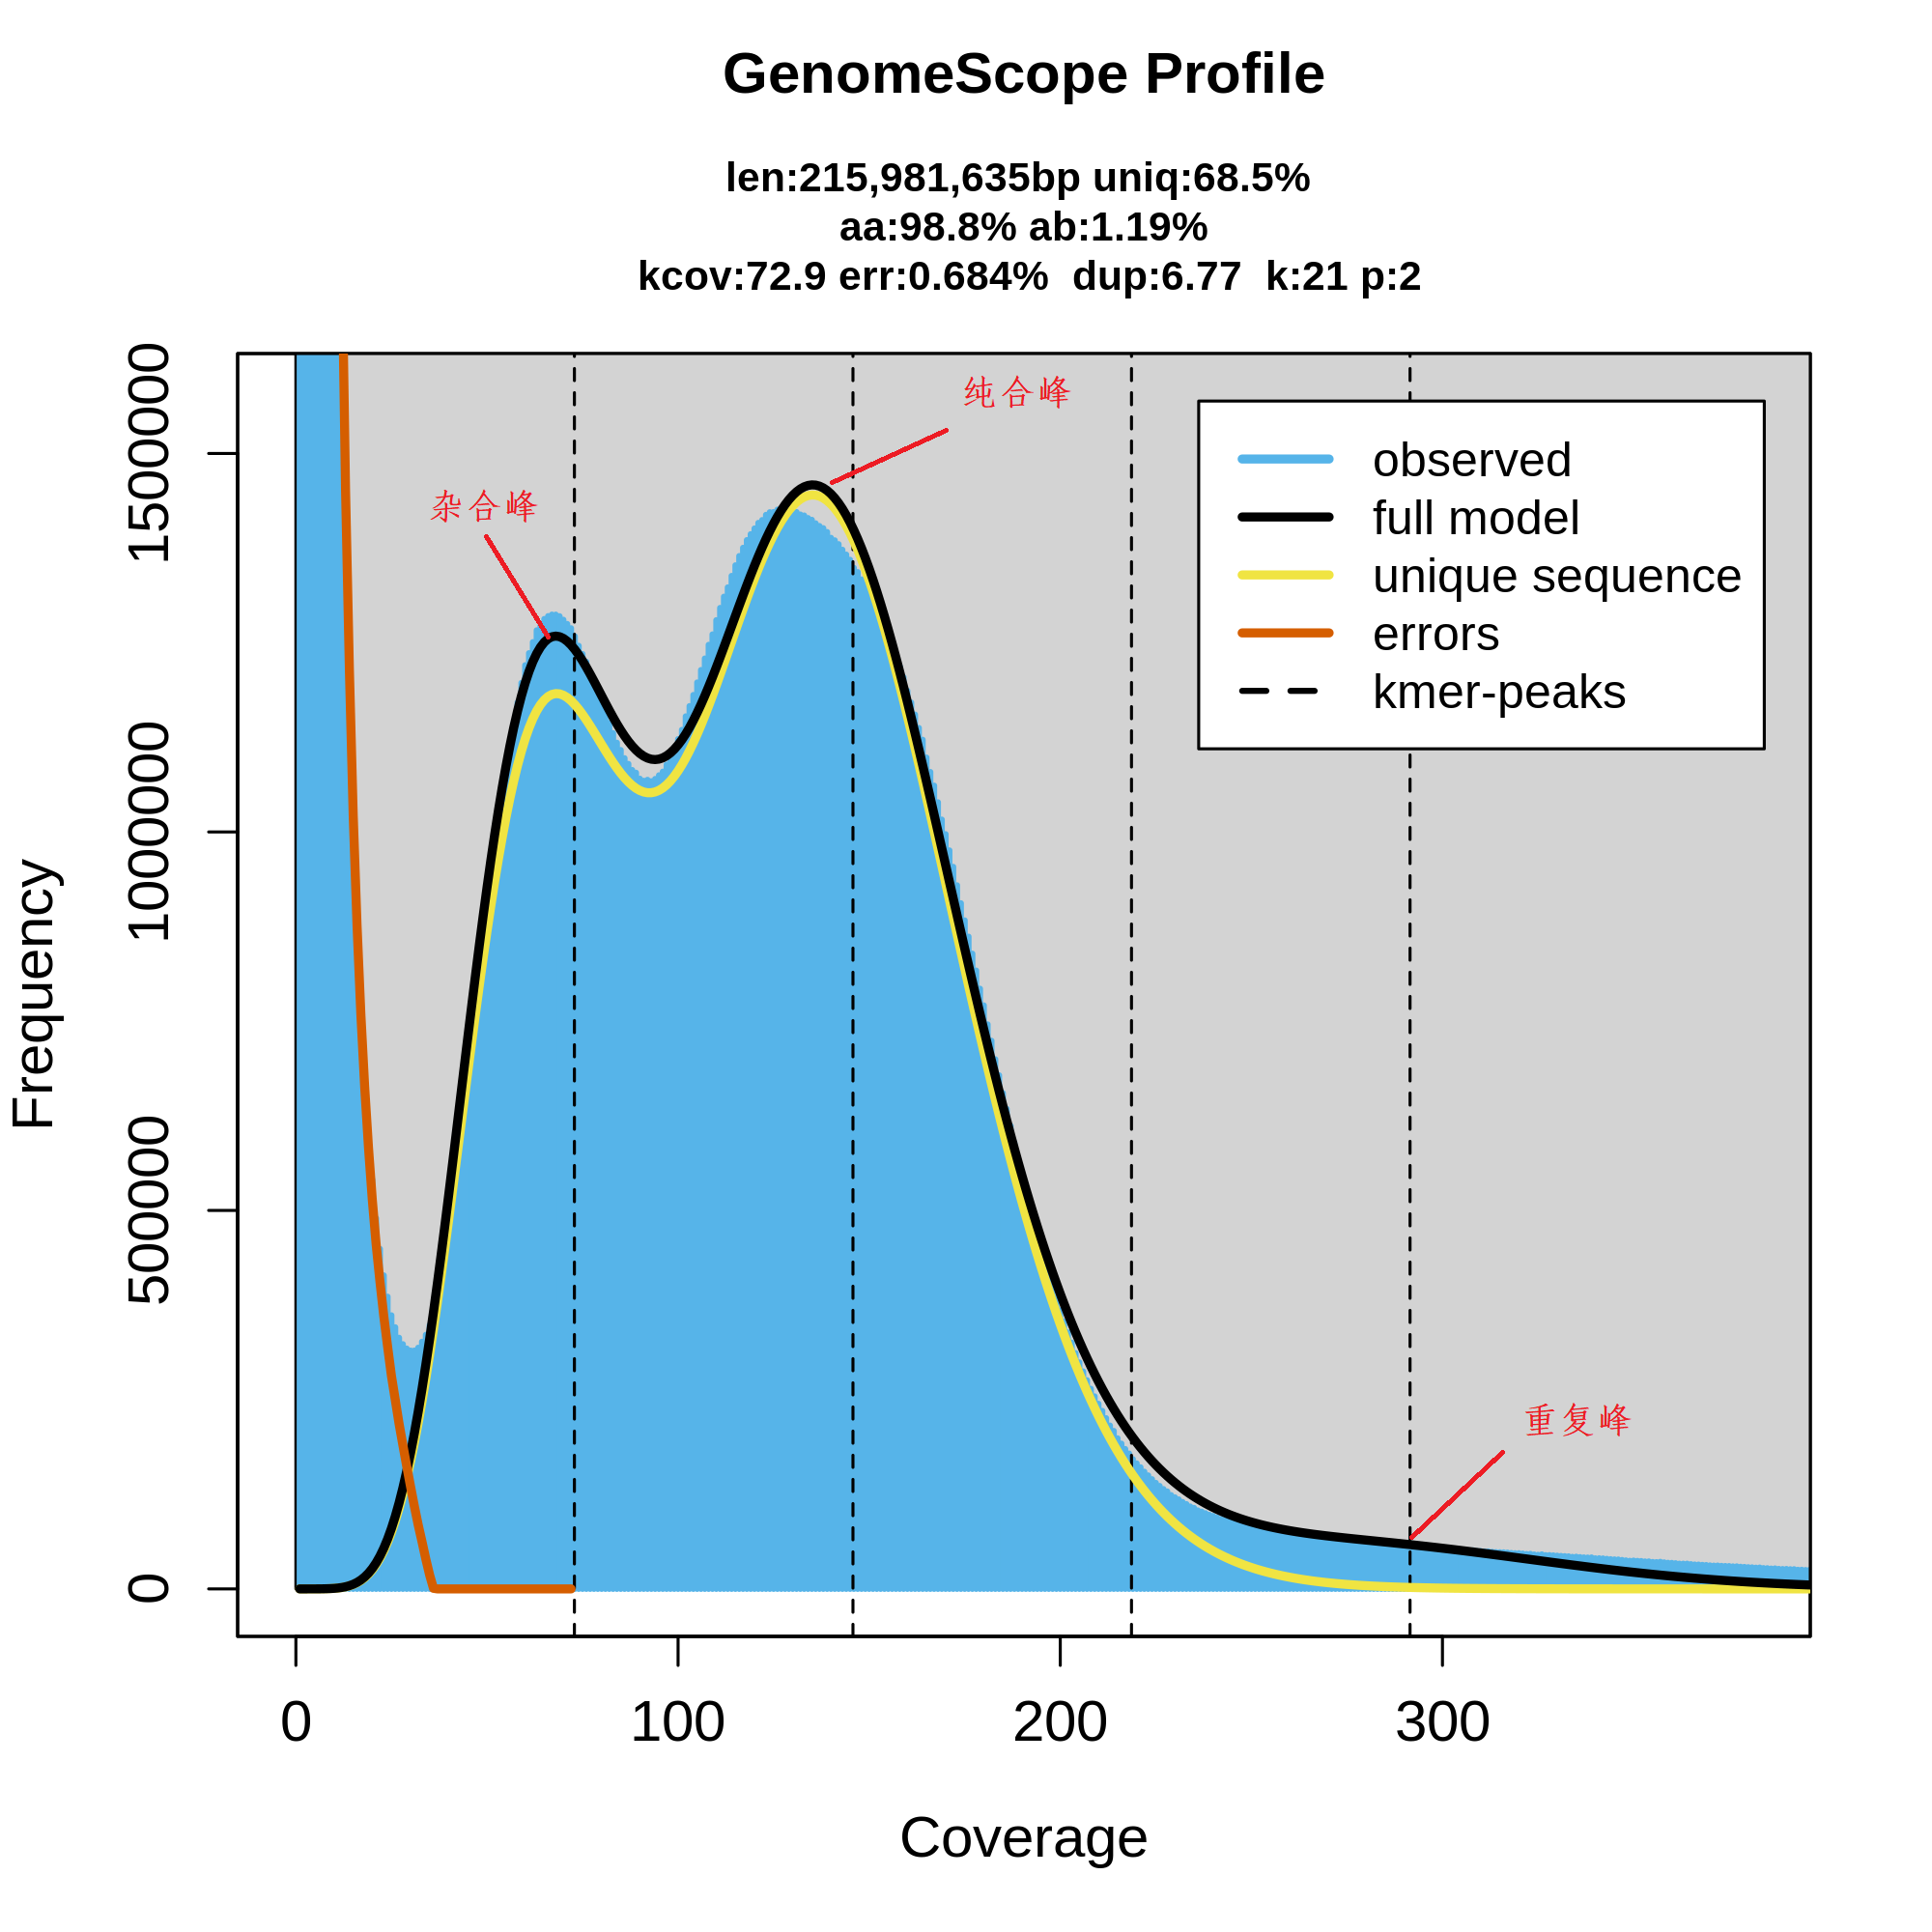
aa:98.8% ab:1.19%
Model converged het:0.0119 kcov:72.9 err:0.00684 model fit:6.77 len:215981635
  • linear_plot.png

linear_plot

aa - 纯合子(Homozygous);ab - 杂合子(Heterozygous);het - 杂合率;kcov - 杂合碱基的平均 k-mer 覆盖率(请注意,由于实际数据中的过度分散,峰的顶部不会与 kcov 线相交),也就是上图杂合峰的覆盖率;err - read 的错误率;dup - read 的平均重复率(average rate of read duplications);len - 推断的基因组大小,需要注意的是,这题提到的基因组大小是单倍体基因组大小;uniq - 独特(非重复)基因组的百分比;k k-mer 长度;p - 设置的基因组倍性;Model Fit - 模型拟合。

为了得到更好的结果,我们通常需要根据自己测序数据的特点进行参数调整;主要有以下建议:

  • -l — 用于 Genomescope 设置平均 k-mer 覆盖率。
  • -h — 用于 jellyfish 中设置覆盖度范围;对于重复率高或大型基因组,建议将其设置为 1000000

linear_plot.png 图显示了每个 k-mer 的出现频率的统计,横轴表示一个 k-mer 出现的频率,纵轴表示出现该频率的 k-mer 数量;若图左侧出现频率为 1 的大量唯一 K-mer 是由于 PCR 错误造成的,一般来说,对于给定的序列,单个 PCR 错误将会导致 k 个唯一且不正确的 k-mers。此外,这里出现了两个峰,且物种是二倍体,则说明该基因组杂合度很高,1.19% 高于我们上面提到的 1%,这也说明该物种的基因组很难组装。

一般地,杂合峰出现在纯合峰的左侧,且在纯合峰覆盖率的 处,而重复峰则出现在纯合峰下来最后又突起的地方。

K-mer 图:使用观察到 K-mer 的次数(覆盖率)通过具有该覆盖率的 K-mer 数量(频率)来估计基因组的原始 DNA 读数的覆盖深度。

GenomeScope2 的建模分析

平均 k-mer 覆盖率()公式

— 平均 k-mer 覆盖率; — reads 的数量; — read 的平均长度; — k-mer 的长度; — 基因组大小。这有效地将峰值从平均核苷酸覆盖率下移了 %。

基因组大小(G)估计

— 为 k-mer 的总数量, — 为 k-mer 的期望测序深度;通常我们将 k-mer 深度分布曲线的峰值作为其期望深度。

References

[1] https://www.jianshu.com/p/1f01131cc030

[2] https://github.com/tbenavi1/genomescope2.0

[3] https://bioinformaticsworkbook.org/dataAnalysis/GenomeAssembly/genomescope.html

[4] https://www.biorxiv.org/content/biorxiv/suppl/2017/02/28/075978.DC2/075978-1.pdf

[5] https://www.ncbi.nlm.nih.gov/pmc/articles/PMC5870704/

[6] http://schatzlab.cshl.edu/publications/posters/2016/2016.AGBT.GenomeScope.pdf